
Tesla Battery Health: Real Data from 3 Cars Tracked with Voltayze
Battery degradation is the number one concern for Tesla owners — and for good reason. Using a Tesla battery health tracker is the most reliable way to know exactly where your battery stands, because your battery is the most expensive component in the car and its health directly affects your range, your resale value, and your long-term running costs.
But how much does a Tesla battery actually degrade in the real world? Most articles cite Tesla’s warranty figures or cherry-picked owner reports. We did something different: we used our Tesla battery health tracker, Voltayze, to pull real data from three actual cars with very different mileage and charging habits. Here’s what we found.
Key finding: charging behaviour matters far more than mileage. One of our tracked cars has 66,000 km and only 3.5% degradation — better than a car with fewer kilometres but more frequent DC fast charging.
Three cars tracked with our Tesla battery health tracker
All three cars are Tesla Model 3s connected to Voltayze. We’ve anonymised the owners but kept all data accurate.
| Car 1 | Car 2 (H*****) | Car 3 (K*******) | |
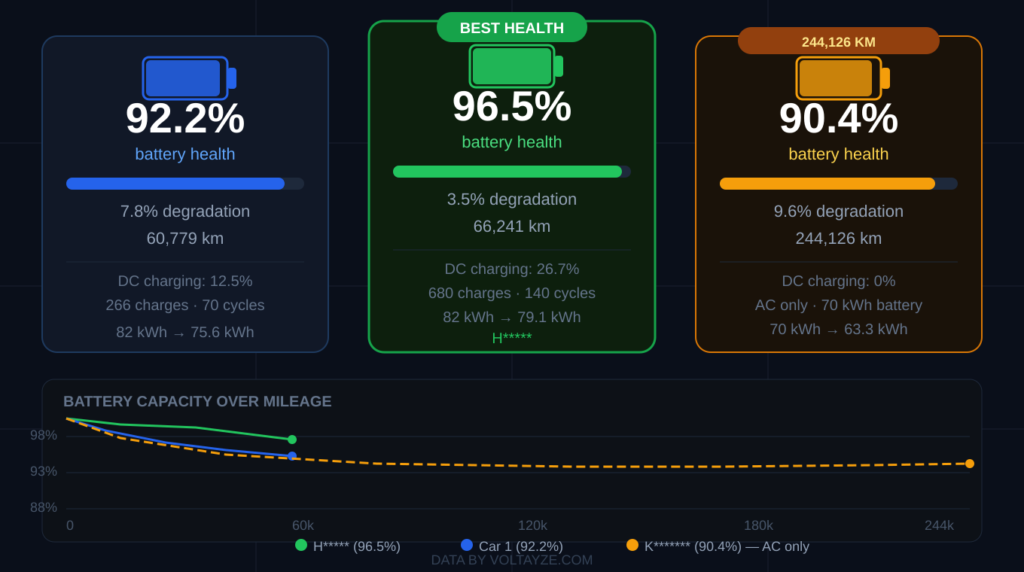
| Odometer | 60,779 km | 66,241 km | 244,126 km |
| Battery (new) | 82 kWh | 82 kWh | 70 kWh |
| Battery (now) | 75.6 kWh | 79.1 kWh | 63.3 kWh |
| Degradation | 7.8% | 3.5% | 9.6% |
| Battery health | 92.2% | 96.5% | 90.4% |
| DC fast charging | 12.45% | 26.65% | 0% |
| Total charges | 266 | 680 | 17 (recently connected) |
Car 1: 60,779 km, 7.8% degradation
This car has covered just over 60,000 km and shows 7.8% battery degradation — meaning it now holds 75.6 kWh of its original 82 kWh. That’s a loss of 6.4 kWh, which translates to roughly 16 km less maximum range compared to when new.
The charging split is 87.5% AC (home charging) and 12.5% DC (Supercharger). This is a healthy ratio — the car is primarily charged at home overnight, with occasional fast charging for longer trips.
What this means in practice: at 60,000 km this car still has 92.2% of its original battery capacity. Tesla’s warranty covers degradation below 70% within 8 years or 160,000 km — this car is nowhere near that threshold.
Car 2 (H*****): 66,241 km, only 3.5% degradation
This is the standout result in our dataset. H***** has covered more kilometres than Car 1 — 66,241 km — yet shows only 3.5% degradation. The battery sits at 96.5% health, holding 79.1 kWh of its original 82 kWh.
What makes this remarkable is the charging pattern: H***** has 680 total charges and 140 full charging cycles — significantly more charge events than Car 1’s 266. Yet degradation is less than half.
The key difference: H***** uses DC fast charging more frequently — 26.65% of total energy comes from Superchargers. You might expect this to cause more degradation, but the data tells a more nuanced story. Consistent partial charging (never charging to 100% unnecessarily, never depleting to 0%) appears to outweigh the impact of occasional fast charging sessions.
Car 3 (K*******): 244,126 km, 9.6% degradation — the long game
This is the most fascinating data point. K******* has covered an extraordinary 244,126 km — more than four times the mileage of the other two cars — and shows only 9.6% degradation. Battery health sits at 90.4%, holding 63.3 kWh of its original 70 kWh.
Crucially, this car has never used DC fast charging. Every single charge — 100% of its 533 kWh total energy added — has come from AC home charging. The battery capacity graph is remarkably flat over the last 2,000 km of tracked data, suggesting degradation has largely stabilised.
The headline number: 244,000 km with only 9.6% battery loss. This is exceptional real-world data that challenges the common fear that high mileage destroys EV batteries.
What the data tells us about Tesla battery degradation
1. Degradation is front-loaded
All three cars show the same pattern seen in broader Tesla studies: the steepest degradation happens in the first 30,000–50,000 km, then the rate slows significantly. K*******’s nearly flat capacity curve beyond 240,000 km is strong evidence of this.
2. Charging behaviour matters more than mileage
The comparison between Car 1 and H***** is striking. More kilometres, more charges, more fast charging — yet better battery health. The explanation lies in charging discipline: avoiding regular full charges to 100%, avoiding deep discharges, and keeping the battery in the 20–80% range for daily use.
3. AC home charging is the kindest option for long-term health
K*******’s 244,000 km on purely AC charging with 9.6% degradation is the strongest argument for making home charging your primary method. DC fast charging is convenient and fine for occasional use, but the data suggests a lifetime of predominantly AC charging protects the battery significantly over the long run.
4. Tesla batteries hold up remarkably well
Across all three cars, the degradation numbers are better than most owners fear. The average across our three cars is 7% degradation — and the highest mileage car is the one most people would expect to be worst, yet it’s competitive with the lower-mileage cars.
How to protect your Tesla battery: practical tips from the data
- Charge to 80% for daily use — only charge to 100% before long trips
- Avoid regularly depleting below 10-15% — deep discharges accelerate degradation
- Use home AC charging as your primary method — limit Supercharger use to road trips
- Pre-condition the battery in cold weather while still plugged in — reduces thermal stress
- Park in a garage or shade in summer — extreme heat is harder on batteries than cold
- Use scheduled charging to avoid leaving the car at 100% for extended periods
How Voltayze works as a Tesla battery health tracker
The data in this article comes directly from Voltayze’s battery health dashboard, which connects to your Tesla via the official Tesla API and tracks capacity, degradation, and charging patterns over time.
Unlike a one-time check, Voltayze builds a continuous picture of your battery’s health — so you can see degradation trends, spot anomalies early, and have hard data if you ever need to make a warranty claim or sell your car.
- Real-time battery capacity reading (usable kWh now vs when new)
- Degradation percentage tracked over mileage and time
- AC vs DC charging split — see how your habits compare
- Battery capacity graph by mileage — visualise your degradation curve
- Charging cycle counter and efficiency tracking
Want to track your own Tesla battery health? Voltayze gives you a 30-day free trial — no credit card required. Connect your car and within 24 hours you’ll have your own battery health dashboard with your real degradation data.
Frequently asked questions
How much battery degradation is normal for a Tesla?
Based on our data and broader owner studies, 1–2% per year in the first few years is typical, slowing to well under 1% annually at higher mileages. Tesla’s warranty covers degradation below 70% capacity within 8 years or 160,000 km (Model 3 Long Range). Most owners never get close to this threshold.
Does Supercharging damage Tesla batteries?
Occasional Supercharging does not significantly damage Tesla batteries — our data shows H***** with 26.65% DC charging and better health than a car with less fast charging. However, using Superchargers as your primary charging method over hundreds of thousands of kilometres is likely to accelerate degradation compared to predominantly AC charging.
How can I use a Tesla battery health tracker to check my battery?
Tesla does not provide a direct battery health percentage in the car’s own UI. The most accurate way to track it is via a third-party Tesla battery health tracker like Voltayze, which reads your battery’s actual usable capacity from the Tesla API and compares it to the original factory capacity.
Does cold weather permanently damage Tesla batteries?
No — cold weather reduces available range temporarily but does not cause permanent degradation. The range returns when the battery warms up. Permanent degradation is caused by electrochemical processes over charging cycles, not by temperature exposure alone.
What Does Your Tesla Track? 5 Metrics Most Owners Miss